在监控服务之前,您需要通过 Prometheus 客户端库之一为其代码添加仪器(用来监听资源)。这些库实现了 Prometheus 的度量类型。
选择与应用程序编写语言相匹配的 Prometheus 客户端库。这样,您就可以通过应用程序实例上的 HTTP 端点定义和公开内部指标:
非官方第三方客户端库:
当 Prometheus 抓取您实例的 HTTP 端点时,客户端库会将所有跟踪度量的当前状态发送到服务器。
如果您的语言没有可用的客户端库,或者您想避免依赖关系,您也可以自己实现其中一种受支持的公开格式来公开度量指标。
Java 客户端库示例
下面将介绍如何通过 Prometheus 的 Java 客户端库快速实现一个自定义的仪器,公开关键指标。
添加依赖
我们使用以下依赖项:
prometheus-metrics-core 是实际的度量库。
prometheus-metrics-instrumentation-jvm 提供开箱即用的 JVM 指标。
prometheus-metrics-exporter-httpserver 是一个独立的 HTTP 服务器,用于公开 Prometheus 指标。
在 maven 的 pom.xml 中,添加如下依赖:
<dependency>
    <groupId>io.prometheus</groupId>
    <artifactId>prometheus-metrics-core</artifactId>
    <version>1.0.0</version>
</dependency>
<dependency>
    <groupId>io.prometheus</groupId>
    <artifactId>prometheus-metrics-instrumentation-jvm</artifactId>
    <version>1.0.0</version>
</dependency>
<dependency>
    <groupId>io.prometheus</groupId>
    <artifactId>prometheus-metrics-exporter-httpserver</artifactId>
    <version>1.0.0</version>
</dependency>
注意:如果您使用的是 Tomcat 或 Undertow 等 Servlet 容器,您可能需要使用 prometheus-exporter-servlet-jakarta 而不是独立的 HTTP 服务器。
prometheus 广告位
示例代码
下面简单通过 Prometheus 的 Java 客户端实现 JVM 指标暴露,如下:
package com.hxstrive.prometheus.exporter;

import io.prometheus.metrics.core.metrics.Counter;
import io.prometheus.metrics.exporter.httpserver.HTTPServer;
import io.prometheus.metrics.instrumentation.jvm.JvmMetrics;

import java.io.IOException;

/**
 * 使用 Prometheus 的 Java 客户端库,实现一个简单的 HTTP 服务,暴露出 Prometheus 的指标
 * @author HuangXin
 * @since 1.0.0  2024/4/24 11:07
 */
public class DemoApp {

    public static void main(String[] args) throws InterruptedException, IOException {
        JvmMetrics.builder().register(); // 初始化开箱即用的 JVM 指标

        Counter counter = Counter.builder()
                .name("my_count_total")
                .help("example counter")
                .labelNames("status")
                .register();

        counter.labelValues("ok").inc();
        counter.labelValues("ok").inc();
        counter.labelValues("error").inc();

        HTTPServer server = HTTPServer.builder()
                .port(9400)
                .buildAndStart();

        System.out.println("HTTPServer listening on port http://localhost:" + server.getPort() + "/metrics");

        Thread.currentThread().join(); // 长眠
    }

}
运行客户端代码,输出如下:
HTTPServer listening on port http://localhost:9400/metrics
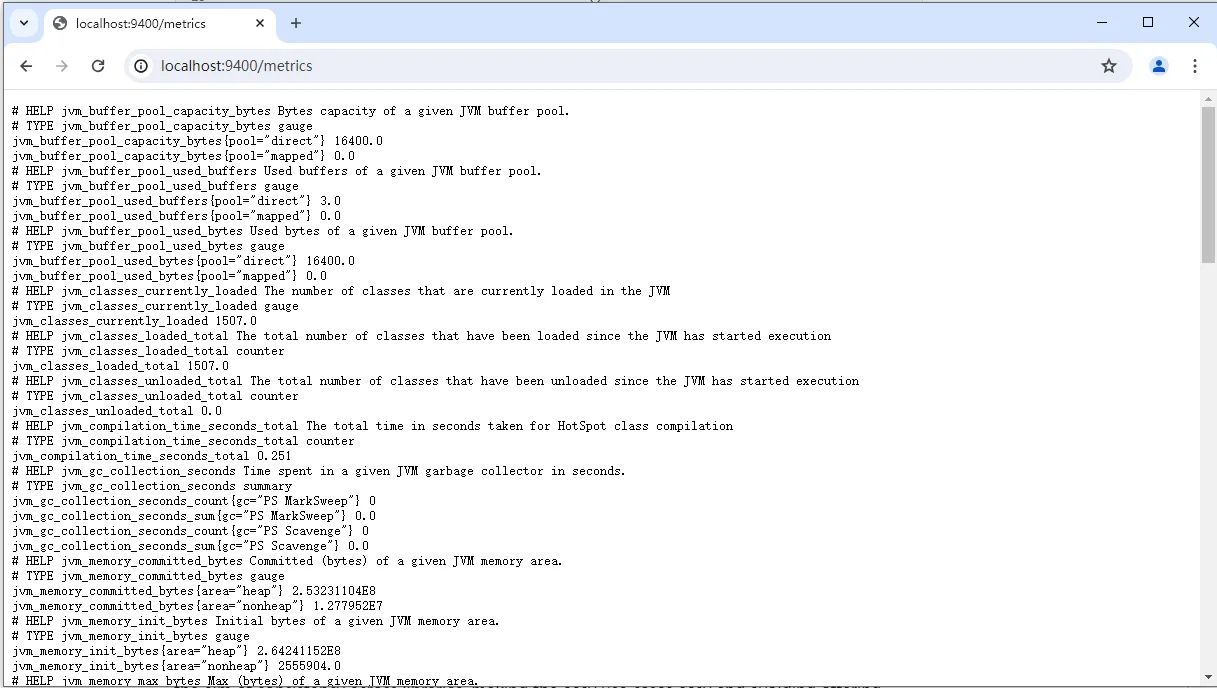
运行应用程序并使用浏览器查看 http://localhost:9400/metrics,以查看原始指标。您应该能看到如下所示的 my_count_total 指标以及来自 JvmMetrics 的 jvm_ 和 process_ 指标。如下图:
最后,配置 Prometheus,让它抓取数据:
global:
  scrape_interval: 10s # short interval for manual testing
scrape_configs:
  - job_name: "java-example"
    static_configs:
      - targets: ["localhost:9400"]

 川公网安备51010802032098